Production Monitoring: You Can't Fix What You Can't See

Previous parts: Part 1: Kafka Producer | Part 2: Consumer + DLQ | Part 3: Real-Time Aggregations | Part 4: Docker + Kubernetes
You know that feeling when your app is running in production and someone asks “Is everything okay?” and you respond with “…I think so?” Yeah, that’s not good enough.
After deploying StreamMetrics to Kubernetes with a 3-node KRaft Kafka cluster, dockerized microservices, and validated 10K events/sec throughput, I realized I was flying blind. Sure, the pods were running. The logs looked fine. But I had no idea:
- How much memory each service was using
- Whether consumer lag was building up
- If HTTP request latencies were spiking
- When Redis was about to run out of memory
This is the story of adding production-grade monitoring to StreamMetrics using Prometheus and Grafana, discovering why Spring Boot metrics need special dependencies, why imported Grafana dashboards break mysteriously, and why ${DS_PROMETHEUS} is the most frustrating variable in observability.
Objective:
- Set up Prometheus for metrics collection,
- Grafana for visualization,
- create custom dashboards for JVM/Kafka/Redis metrics, and
- configure alerts for consumer lag and pod failures.
Why Monitoring Matters (Beyond “It’s Running”) #
The Production Incident That Never Happened #
Imagine this scenario:
- Consumer starts falling behind (lag builds to 10K messages)
- JVM heap slowly fills up (90% usage)
- GC pauses increase (300ms → 2 seconds)
- HTTP requests start timing out
- Pod gets OOMKilled
- Kubernetes restarts it
- Repeat
Without monitoring: You find out when users complain. With monitoring: Alert fires at step 1, you scale before step 4.
That’s the difference.
The Monitoring Stack: Prometheus + Grafana #
Why Prometheus? #
Prometheus is the de-facto standard for Kubernetes monitoring because:
- Pull-based: Scrapes metrics from /metrics endpoints
- Time-series database: Stores metrics with timestamps
- PromQL: Powerful query language for aggregations
- Service discovery: Auto-discovers pods via Kubernetes API
- Alert manager: Built-in alerting
Why Grafana? #
Grafana turns raw metrics into visual insights:
- Beautiful dashboards
- Supports multiple data sources (Prometheus, Loki, etc.)
- Templating and variables
- Alerting (can also use Prometheus AlertManager)
- JSON-based dashboard sharing
The Architecture #

Step 1: Installing Prometheus Stack with Helm #
Instead of deploying Prometheus and Grafana manually (hundreds of YAML lines), we use kube-prometheus-stack - a batteries-included Helm chart.
Install Helm #
# macOS
brew install helm

# Verify
helm version
Install Prometheus Stack #
# Add Helm repo
helm repo add prometheus-community https://prometheus-community.github.io/helm-charts
helm repo update

# Create monitoring namespace
kubectl create namespace monitoring

# Install the stack
helm install prometheus prometheus-community/kube-prometheus-stack \
  --namespace monitoring \
  --set prometheus.prometheusSpec.serviceMonitorSelectorNilUsesHelmValues=false \
  --set grafana.adminPassword=admin123

# Wait for pods (2-3 minutes)
kubectl get pods -n monitoring -w
What this installs:
- Prometheus server (metrics storage)
- Grafana (visualization)
- AlertManager (alerting)
- Node exporter (host-level metrics)
- Kube-state-metrics (Kubernetes object metrics)
- Prometheus operator (manages Prometheus via CRDs)
The magic flag: serviceMonitorSelectorNilUsesHelmValues=false tells Prometheus to scrape ALL ServiceMonitors, not just ones with specific labels. Critical for discovering our apps.
Access Grafana #
# Port-forward Grafana
kubectl port-forward -n monitoring svc/prometheus-grafana 3000:80

# Open browser
open http://localhost:3000

# Login: admin / admin123
You should see Grafana’s home page with default Kubernetes dashboards already configured!
Step 2: Exposing Metrics from Spring Boot #
Spring Boot apps don’t expose Prometheus metrics by default. We need Micrometer.
Add Dependencies #
Update all three modules (producer, consumer, streams) pom.xml:
xml
<dependency>
    <groupId>io.micrometer</groupId>
    <artifactId>micrometer-registry-prometheus</artifactId>
</dependency>
Configure Metrics Endpoint #
Update application.yml in all modules:
management:
  endpoints:
    web:
      exposure:
        include: health,info,metrics,prometheus
  metrics:
    export:
      prometheus:
        enabled: true
    tags:
      application: ${spring.application.name}
      environment: kubernetes
What this does:
- Exposes /actuator/prometheus endpoint
- Formats metrics in Prometheus format
- Adds tags to every metric (helps filter in queries)
Rebuild and Redeploy #
mvn clean package -DskipTests

eval $(minikube docker-env)

docker build -f streammetrics-producer/Dockerfile -t streammetrics-producer:latest .
docker build -f streammetrics-consumer/Dockerfile -t streammetrics-consumer:latest .
docker build -f streammetrics-streams/Dockerfile -t streammetrics-streams:latest .

# Restart deployments
kubectl rollout restart deployment/producer -n streammetrics
kubectl rollout restart deployment/consumer -n streammetrics
kubectl rollout restart deployment/streams -n streammetrics
Verify Metrics Endpoint #
kubectl port-forward -n streammetrics deployment/producer 8085:8085 &

curl http://localhost:8085/actuator/prometheus | head -20

# Should show:
# # HELP jvm_memory_used_bytes The amount of used memory
# # TYPE jvm_memory_used_bytes gauge
# jvm_memory_used_bytes{area="heap",id="G1 Eden Space"} 1.2345678E7
# ...
If you see Prometheus-formatted metrics, you’re golden!
Step 3: ServiceMonitors - Auto-Discovery Magic #
Prometheus Operator uses ServiceMonitors (a Custom Resource Definition) to discover what to scrape.
The Pattern #
For each app, we need:
- A Service that exposes the metrics port
- A ServiceMonitor that tells Prometheus to scrape it
Producer ServiceMonitor #
Create k8s/monitoring/servicemonitors/producer-servicemonitor.yaml:
apiVersion: v1
kind: Service
metadata:
  name: producer-metrics
  namespace: streammetrics
  labels:
    app: producer
spec:
  ports:
    - name: metrics
      port: 8085
      targetPort: 8085
  selector:
    app: producer
---
apiVersion: monitoring.coreos.com/v1
kind: ServiceMonitor
metadata:
  name: producer-monitor
  namespace: streammetrics
  labels:
    release: prometheus  # Important: matches Helm release
spec:
  selector:
    matchLabels:
      app: producer
  endpoints:
  - port: metrics
    path: /actuator/prometheus
    interval: 30s
Key points:
- labels.release: prometheus - Must match your Helm release name
- interval: 30s - Scrape every 30 seconds
- path: /actuator/prometheus - Where Spring Boot exposes metrics
Create for Consumer and Streams #
Repeat the same pattern for consumer (port 8081) and streams (port 8082).
Apply all ServiceMonitors:
kubectl apply -f k8s/monitoring/servicemonitors/

# Check they exist
kubectl get servicemonitor -n streammetrics

# Should show:
# NAME               AGE
# producer-monitor   10s
# consumer-monitor   10s
# streams-monitor    10s
Verify Prometheus is Scraping #
# Port-forward Prometheus
kubectl port-forward -n monitoring svc/prometheus-kube-prometheus-prometheus 9090:9090 &

# Open Prometheus UI
open http://localhost:9090
- Go to Status → Targets
- Look for: streammetrics/producer-monitor, consumer-monitor, streams-monitor
- Status should be: UP (green)
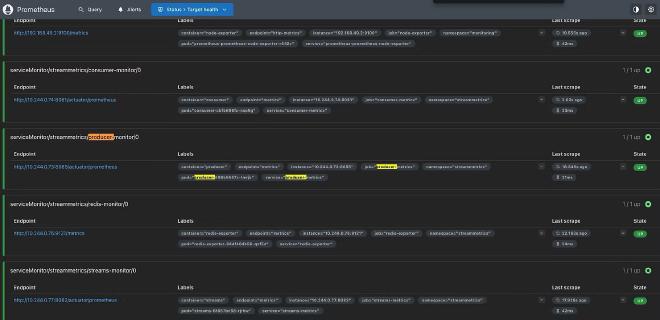
Prometheus Service Monitors

If targets are UP, Prometheus is successfully scraping!
If targets are DOWN, check:
- ServiceMonitor labels match Helm release
- Service selector matches pod labels
- Pod is actually running and healthy
Step 4: Creating Grafana Dashboards #
The JVM Dashboard Saga #
Attempt 1: Import community dashboard ID 4701 (JVM Micrometer)
Result: Error - “Data source ${DS_PROMETHEUS} was not found”
Why it fails: Imported dashboards use variables that don’t match your datasource name.
The fix:
- Dashboard Settings → JSON Model
- Find all “${DS_PROMETHEUS}”
- Replace with “Prometheus” (your actual datasource name)
- Save
OR - Create the variable manually:
- Dashboard Settings → Variables → Add variable
- Name: DS_PROMETHEUS
- Type: Data source
- Query: Prometheus
- Save
Building a Custom Dashboard (Recommended) #
Instead of fighting with imported dashboards, let’s build one from scratch.
Create New Dashboard → Add Panels: #
Panel 1: JVM Heap Memory Usage #
jvm_memory_used_bytes{namespace="streammetrics", area="heap"}
Panel 2: CPU Usage %
rate(process_cpu_seconds_total{namespace="streammetrics"}[1m]) * 100
Panel 3: Kafka Messages Sent/sec #
Spring Boot exposes Kafka template metrics:
rate(spring_kafka_template_seconds_count{namespace="streammetrics"}[1m])
Note: We discovered that Kafka Streams doesn’t expose kafka_streams_* metrics by default. Instead, we use Spring Boot’s spring_kafka_template_* metrics.
Panel 4: Pod Status #
up{namespace="streammetrics"}
Panel 5: HTTP Requests per Second #
rate(http_server_requests_seconds_count{namespace="streammetrics"}[1m])
Save dashboard as: “StreamMetrics - Application Metrics”
Step 5: Redis Metrics with Exporter #
Redis doesn’t expose Prometheus metrics natively. We need a sidecar exporter.


Create k8s/monitoring/redis-exporter.yaml:
apiVersion: apps/v1
kind: Deployment
metadata:
  name: redis-exporter
  namespace: streammetrics
spec:
  replicas: 1
  selector:
    matchLabels:
      app: redis-exporter
  template:
    metadata:
      labels:
        app: redis-exporter
    spec:
      containers:
      - name: redis-exporter
        image: oliver006/redis_exporter:latest
        ports:
        - containerPort: 9121
        env:
        - name: REDIS_ADDR
          value: "redis:6379"
---
apiVersion: v1
kind: Service
metadata:
  name: redis-exporter
  namespace: streammetrics
  labels:
    app: redis-exporter
spec:
  ports:
  - port: 9121
    targetPort: 9121
    name: metrics
  selector:
    app: redis-exporter
---
apiVersion: monitoring.coreos.com/v1
kind: ServiceMonitor
metadata:
  name: redis-monitor
  namespace: streammetrics
  labels:
    release: prometheus
spec:
  selector:
    matchLabels:
      app: redis-exporter
  endpoints:
  - port: metrics
    interval: 30s
Deploy:
kubectl apply -f k8s/monitoring/redis-exporter.yaml

# Wait
kubectl wait --for=condition=ready pod -l app=redis-exporter -n streammetrics --timeout=60s
Add Redis panels to dashboard:
Redis Memory Usage:
redis_memory_used_bytes{namespace="streammetrics"}
Redis Keys Count:
redis_db_keys{namespace="streammetrics"}
Redis Operations/sec:
rate(redis_commands_processed_total{namespace="streammetrics"}[1m])
Step 6: Alerting - When Things Go Wrong #
Dashboards are great for investigation, but you need alerts for production.
Create k8s/monitoring/alerts.yaml:
apiVersion: monitoring.coreos.com/v1
kind: PrometheusRule
metadata:
  name: streammetrics-alerts
  namespace: streammetrics
  labels:
    release: prometheus
spec:
  groups:
  - name: streammetrics
    interval: 30s
    rules:

    # Alert: Pod is down
    - alert: PodDown
      expr: up{namespace="streammetrics"} == 0
      for: 1m
      labels:
        severity: critical
      annotations:
        summary: "Pod {{ $labels.pod }} is down"
        description: "{{ $labels.pod }} in {{ $labels.namespace }} has been down for 1 minute"

    # Alert: High memory usage (>90%)
    - alert: HighMemoryUsage
      expr: (jvm_memory_used_bytes{area="heap",namespace="streammetrics"} / jvm_memory_max_bytes{area="heap",namespace="streammetrics"}) > 0.9
      for: 5m
      labels:
        severity: warning
      annotations:
        summary: "{{ $labels.pod }} memory usage is high"
        description: "{{ $labels.pod }} is using {{ $value | humanizePercentage }} of heap memory"

    # Alert: High HTTP error rate
    - alert: HighErrorRate
      expr: rate(http_server_requests_seconds_count{status=~"5..",namespace="streammetrics"}[5m]) > 0.1
      for: 5m
      labels:
        severity: critical
      annotations:
        summary: "High HTTP error rate on {{ $labels.uri }}"
        description: "{{ $labels.uri }} has {{ $value }} errors/sec"
Apply:
kubectl apply -f k8s/monitoring/alerts.yaml

# View alerts in Prometheus
open http://localhost:9090/alerts
Alert states:
- Inactive (green): Condition is false
- Pending (yellow): Condition true, waiting for for duration
- Firing (red): Alert is active, notifications sent
Step 7: Testing the Monitoring #
Generate Load #
# Port-forward producer
kubectl port-forward -n streammetrics svc/producer 8085:8085 &

# Send 1000 events
for i in {1..10}; do
  curl "http://localhost:8085/produce?events=100"
  sleep 1
done
Watch the Dashboard Update #
Open Grafana → StreamMetrics dashboard
You should see:
- CPU spike as producer sends events
- Memory increase in consumer
- HTTP requests/sec jump to 10 req/sec
- Kafka messages sent counter increasing
- HTTP request duration (p95) showing latency
This is the magic moment - seeing your application’s behavior in real-time!
Production Lessons Learned #
1. ServiceMonitors Must Match Helm Release #
This error consumed 30 minutes:
Error: ServiceMonitor not discovered by Prometheus
Root cause: ServiceMonitor labels didn’t match Prometheus selector.
Fix: Add labels.release: prometheus to match Helm release name.
2. Imported Dashboards Break with Variables #
Community dashboards use ${DS_PROMETHEUS} as a variable, but your datasource is named “Prometheus”.
Solution: Create custom dashboards or fix the JSON manually.
3. Spring Boot Kafka Metrics Are Limited #
We expected kafka_consumer_fetch_manager_records_lag_max but got spring_kafka_template_seconds_*.
Why: Spring Boot’s Kafka integration exposes template metrics, not consumer internals.
Solution: Use what’s available or add custom metrics with MeterRegistry.
4. Redis Needs an Exporter #
Unlike Spring Boot apps with /actuator/prometheus, Redis requires a separate exporter pod.
Pattern: For any non-Prometheus-native service (MySQL, MongoDB, etc.), use an exporter.
5. PromQL is Powerful but Tricky #
Wrong query:
jvm_memory_used_bytes # Shows all memory types
Right query:
jvm_memory_used_bytes{area="heap", namespace="streammetrics"} # Filtered
Learn PromQL: It’s the key to unlocking insights.
Exporting and Sharing Dashboards #
Export Dashboard #
In Grafana:
- Open dashboard
- Click “Share” (top right)
- Click “Export” tab
- Toggle “Export for sharing externally” ON
- Save to file
Import Dashboard Later #
# In Grafana UI
Dashboards → Import → Upload JSON file

# Or via API
curl -X POST \
  -H "Content-Type: application/json" \
  -u admin:admin123 \
  http://localhost:3000/api/dashboards/db \
  -d @k8s/monitoring/dashboards/streammetrics-dashboard.json
Monitoring Best Practices #
1. Start with the Four Golden Signals #
From Google’s SRE book:
- Latency: How long requests take
- Traffic: How many requests
- Errors: Rate of failed requests
- Saturation: How “full” your service is (CPU, memory)
2. Alert on Symptoms, Not Causes #
Bad alert: “CPU usage > 80%”
Good alert: “HTTP request p99 latency > 500ms”
Why? Users don’t care about CPU, they care about slow responses.
3. Use Percentiles, Not Averages #
# Average - hides outliers
avg(http_server_requests_seconds_sum / http_server_requests_seconds_count)

# P95 - shows what 95% of users experience
histogram_quantile(0.95, rate(http_server_requests_seconds_bucket[5m]))
4. Tag Everything #
metrics:
  tags:
    application: streammetrics-producer
    environment: production
    region: us-west-2
    version: v1.2.3
Makes filtering in PromQL trivial: {application=“streammetrics-producer”, environment=“production”}
5. Keep Dashboards Simple #
Bad dashboard: 50 panels, loads in 30 seconds
Good dashboard: 10 key panels, loads instantly
Create multiple focused dashboards instead of one giant one.
Try It Yourself #
Full code on GitHub: https://github.com/ankitagrahari/StreamAnalytics
Useful Commands #
# Check if Prometheus is scraping targets
kubectl port-forward -n monitoring svc/prometheus-kube-prometheus-prometheus 9090:9090
open http://localhost:9090/targets

# View alerts
open http://localhost:9090/alerts

# Check ServiceMonitors
kubectl get servicemonitor -n streammetrics

# View Prometheus config
kubectl get prometheus -n monitoring -o yaml

# Export dashboard via API
curl -s http://admin:admin123@localhost:3000/api/dashboards/uid/<dashboard-uid> | jq '.dashboard' > dashboard.json
Key Takeaways #
- Monitoring is not optional - Production without observability is gambling
- Prometheus Operator simplifies setup - ServiceMonitors > manual scrape configs
- Start with basics - JVM, HTTP, pod health; expand from there
- Custom dashboards > imported ones - You control the layout and queries
- Alert on what matters - User-facing symptoms, not internal metrics
- PromQL is worth learning - Powerful query language, steep but rewarding
- Export and version-control dashboards - Treat infrastructure as code
Share your thoughts on whether you liked or disliked it. Let me know if you have any queries or suggestions.
Never forget, Learning is the primary goal.