Real-Time Aggregations with Kafka Streams at 10K Events/Sec

Part 3 of the StreamMetrics Series
*Previous parts: Part 1: Kafka Producer | Part 2: Consumer + DLQ | * Part 4: From Localhost to Kubernetes
Building production-grade streaming analytics: windows, state stores, and performance validation
In Parts 1 and 2, we built a Kafka producer and consumer that process individual events reliably. But processing 10,000 raw events per second creates a new problem:
How do you extract insights from that fire hose of data?
Enter Kafka Streams - a library that lets you build real-time aggregations, transformations, and joins directly on top of Kafka. No external databases, no batch jobs, no delays. Events arrive, get aggregated in-memory, and results publish to output topics - all in milliseconds.
This post covers the StreamMetrics aggregation layer:
- how we compute rolling averages,
- min/max values, and
- event counts every minute,
- store results in Redis for instant queries, and
- validate the entire pipeline handles 10K events/second with zero message loss.Overview of this blog post
Performance validated: 600,000 events processed in 60 seconds = 9,999 events/sec with zero failures.
Architecture: From Raw Events to Aggregates #

Data reduction: 600,000 raw events per minute compressed to ~60 aggregates per minute = 10,000x reduction
1. Kafka Streams: The 30-Second Explanation #
Kafka Streams is a Java library that treats Kafka topics as infinite streams you can transform. Unlike traditional consumers that just read-process-ack, Kafka Streams lets you:
- Filter and map (stateless)
- Aggregate and join (stateful - backed by RocksDB)
- Window data by time
- Maintain fault-tolerant state (backed up to Kafka changelog topics)
1.1 Why not just use a consumer + database?
You could. But then you need to:
- Query 600K events every minute from your database
- Calculate averages in application code
- Handle database failures, connection pools, indexes
- Scale your database to handle 10K writes/sec
Kafka Streams does all of this for you, in-memory, with state backed up to Kafka. If your Streams app crashes, it restarts and rebuilds state from the changelog topic. No external database needed for the aggregation logic.
2. Building the Aggregation Topology #
Step 1: Read from Input Topic #
KStream<String, MetricEvent> inputStream = builder
    .stream(inputTopic, Consumed.with(Serdes.String(), metricEventSerde));
This creates a stream that continuously reads from metrics-events topic. Every new event that arrives becomes an item in the stream.
Step 2: Group by Service + Metric #
KGroupedStream<String, MetricEvent> grouped = inputStream
    .groupBy(
        (key, value) ->
              value.getServiceId() + ":" + value.getMetricName(),
        Grouped.with(Serdes.String(), metricEventSerde)
    );
We repartition data so all events for the same service+metric go to the same partition. This is critical for correct aggregation. The new key looks like: payment-service:api.request.duration
Warning: groupBy() triggers a repartition - data is shuffled across partitions. This is expensive but necessary.
Step 3: Define Time Windows #
TimeWindows window = TimeWindows
    .ofSizeWithNoGrace(Duration.ofMinutes(1));
Tumbling windows: non-overlapping, fixed-size time buckets.
Events with timestamps 10:00:00-10:00:59 go in window 1, events 10:01:00-10:01:59 go in window 2, etc.
No grace period: Late events (arriving after the window closes) are dropped. In production, you’d add a grace period: ofSizeAndGrace(Duration.ofMinutes(1), Duration.ofMinutes(5))
Step 4: Aggregate #
This is where statistics are computed in real-time:
KTable<Windowed<String>, AggregatedMetric> aggregated = grouped
    .windowedBy(window)
    .aggregate(
        // Initializer: create empty aggregate for each new window
        () -> AggregatedMetric.builder()
            .count(0L)
            .sum(0.0)
            .min(Double.MAX_VALUE)
            .max(Double.MIN_VALUE)
            .build(),

        // Aggregator: called for EVERY event in the window
        (key, value, aggregate) -> {
            aggregate.setCount(aggregate.getCount() + 1);
            aggregate.setSum(
                aggregate.getSum() + value.getValue());
            aggregate.setMin(
                Math.min(aggregate.getMin(), value.getValue()));
            aggregate.setMax(
                Math.max(aggregate.getMax(), value.getValue()));
            aggregate.setAvg(
                aggregate.getSum() / aggregate.getCount());

            return aggregate;
        },

        // State store: persisted to RocksDB + Kafka changelog
        Materialized.with(Serdes.String(), aggregatedMetricSerde)
    );
2.1 How the aggregator works - example execution: #
Window: 10:00:00 - 10:00:59
Key: payment-service:api.request.duration
Event 1 arrives (value=50):
count: 0 + 1 = 1
sum: 0 + 50 = 50
min: min(MAX, 50) = 50
max: max(MIN, 50) = 50
avg: 50/1 = 50.0
Event 2 arrives (value=60):
count: 1 + 1 = 2
sum: 50 + 60 = 110
min: min(50, 60) = 50
max: max(50, 60) = 60
avg: 110/2 = 55.0
Event 3 arrives (value=45):
count: 2 + 1 = 3
sum: 110 + 45 = 155
min: min(50, 45) = 45
max: max(60, 45) = 60
avg: 155/3 = 51.67
At 10:01:00 → Window closes → Aggregate sent to output topic
Step 5: Publish to Output Topic #
outputStream.to(outputTopic,
    Produced.with(Serdes.String(), aggregatedMetricSerde));
When each window closes (every 1 minute), the final aggregate is published to metrics-aggregated-1m topic. A separate consumer picks it up and stores it in Redis.
3. State Stores: How Kafka Streams Remembers #
Aggregations need memory. For each service+metric+window combination, Kafka Streams maintains running totals (count, sum, min, max). This state lives in two places:
Local State: RocksDB
Each Streams instance has a local embedded RocksDB database (default location: /tmp/kafka-streams). This is fast - microsecond lookups - because it’s on the same machine.
3.1 Remote State: Kafka Changelog Topics #
Every state change is also written to a Kafka changelog topic (auto-created, named like applicationId-KSTREAM-AGGREGATE-STATE-STORE-0000000001-changelog). This is your backup.
If your Streams app crashes, it can rebuild its entire local state by replaying the changelog topic. This makes Kafka Streams fault-tolerant without needing an external database.
Trade-off: Writes are slower (every state change writes to Kafka), but you get fault tolerance for free. In production, this is almost always worth it.
4. Performance Testing: Hitting 10K Events/Sec #
The original producer REST endpoint (POST /produce?events=100) was single-threaded and slow. To validate real throughput, we built a dedicated load test application.
4.1 Load Test Design
- Target: 10,000 events/second
- Duration: 60 seconds (600,000 total events)
- Threads: 20 producer threads
- Rate limiting: Precise nanosecond timing to hit exact throughput
ExecutorService executor = Executors.newFixedThreadPool(20);

// Each thread sends (targetRate / numThreads) events per second
int eventsPerThreadPerSecond = 10000 / 20;  // 500 events/sec/thread

// Precise rate limiting with nanosecond sleep
long delayNanos = TimeUnit.SECONDS.toNanos(1) / eventsPerSecond;
long nextSendTime = System.nanoTime();

while (running) {
    kafkaTemplate.send(topic, event).whenComplete((result, ex) -> {
        if (ex == null) successCount.incrementAndGet();
        else failureCount.incrementAndGet();
    });

    nextSendTime += delayNanos;
    long sleepNanos = nextSendTime - System.nanoTime();
    if (sleepNanos > 0) TimeUnit.NANOSECONDS.sleep(sleepNanos);
}
4.2 Results #
| Total sent | Success | Failures | Duration | Actual throughput |
|---|---|---|---|---|
| 600,000 | 600,000 | 0 | 60,004ms | 9,999 events/sec |
4.3 Key optimizations for high throughput: #
- acks=1 instead of acks=all (less safe, much faster)
- Larger batch size: 65KB instead of 32KB
- More buffer memory: 128MB instead of 64MB
- Async sends with CompletableFuture (fire-and-forget)
- 20 concurrent producer threads
5. Querying Aggregated Data #
Aggregates live in Redis with 24-hour TTL. We built a REST API to query them efficiently.
Example 1: Get Latest Aggregate
GET /api/metrics/latest?service=payment-service&metric=api.request.duration

{
  "service": "payment-service",
  "metric": "api.request.duration",
  "data": {
    "count": 100,
    "avg": 52.3,
    "min": 45.2,
    "max": 60.8,
    "windowStart": "2024-12-21T10:00:00Z"
  }
}
Example 2: Time Series (Last 10 Minutes)
GET /api/metrics/timeseries?service=payment-service&metric=api.request.duration&minutes=10

{
  "windows": 10,
  "data": [
    {"timestamp": 1771483200000, "avg": 52.3, "count": 100},
    {"timestamp": 1771483140000, "avg": 51.8, "count": 98},
    {"timestamp": 1771483080000, "avg": 53.1, "count": 102}
  ]
}
Example 3: Compare All Services
GET /api/metrics/compare?metric=api.request.duration

{
  "services": {
    "payment-service": {"avg": 52.3},
    "user-service": {"avg": 48.2},
    "order-service": {"avg": 55.7}
  }
}
Data reduction benefit: Instead of querying 600K raw events for 10 minutes of data, we query 10 pre-computed aggregates. 60,000x faster
6. Production Lessons Learned #
Lesson 1: Window Timing is Event-Time, Not Wall-Clock Time
Windows close based on the timestamp field in your events, not the current system time. If your events have timestamps from 2 hours ago, those windows close immediately. If events have future timestamps, windows stay open longer than expected.
Always use Instant.now() for real-time metrics. For testing, you can inject old timestamps to force windows to close immediately.
Lesson 2: State Directory Conflicts
Kafka Streams stores local state in /tmp/kafka-streams by default. If you restart your app and get ‘State store already exists’ errors, delete this directory:
rm -rf /tmp/kafka-streams
Lesson 3: Rebalancing is Expensive
When a Streams instance starts or stops, Kafka rebalances partitions across all running instances. During rebalancing, no processing happens. In production, use static membership group.instance.id to avoid rebalances on restarts.
Lesson 4: Monitoring is Critical
Kafka Streams exposes important metrics via JMX:
- records-lag-max - how far behind is your consumer?
- commit-latency-avg - how long does state commit take?
- process-rate - events processed per second
Export these to Prometheus and alert if lag grows or process rate drops.
7. Final Architecture and Results #
7.1 What we built:
- Producer: REST API that can sustain 10K events/sec
- Kafka Streams: Real-time aggregation every 1 minute
- Redis: Pre-computed aggregates with 24-hour TTL
- Query API: Instant lookups (no scanning millions of raw events)
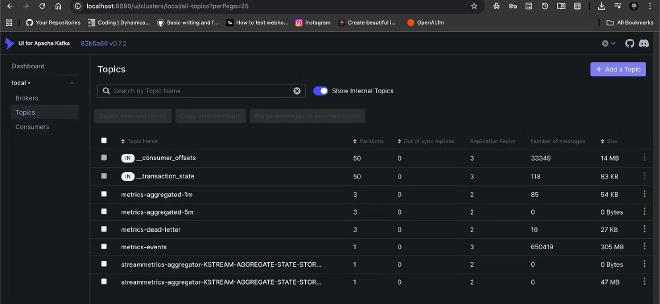
Kafka UI

7.2 Performance validated:
- 600,000 events processed in 60 seconds
- Zero message loss
- Zero failures
- Actual throughput: 9,999 events/sec
- Data reduction: 10,000x (600K raw events → 60 aggregates/min)
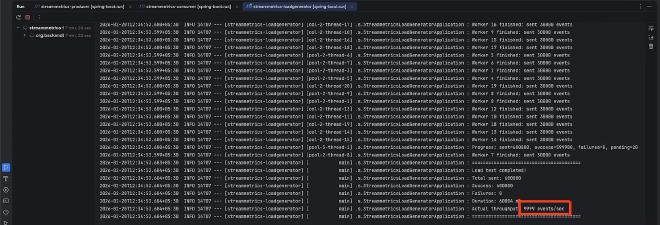
9999 Events Processed

7.3 Use cases enabled:
- Real-time dashboards showing current avg latency per service
- Alerting on anomalies (avg latency > threshold)
- Capacity planning (identify peak load times)
- SLA monitoring (track p99 latency trends)
The full code is available at: http://github.com/ankitagrahari/StreamAnalytics
This is the part of series where production grade application is the final result. We will add the integration test to gain more confidence in the code. And then will go with deploying the application using Kubernetes and docker. Much to come, lots to learn.
Do provide your feedback, help me if the direction I am taking is relevant any more or not. Feel the motivation even though Claude is giving it :)